| fit <- princomp(obs, cor=TRUE) | #1: extracting PCs | |
| summary(fit) | #2: print variance accounted for | |
| loadings(fit) | #3: pc loadings | |
| par(mfrow = c(2,1)) | #4: 2x1 charts | |
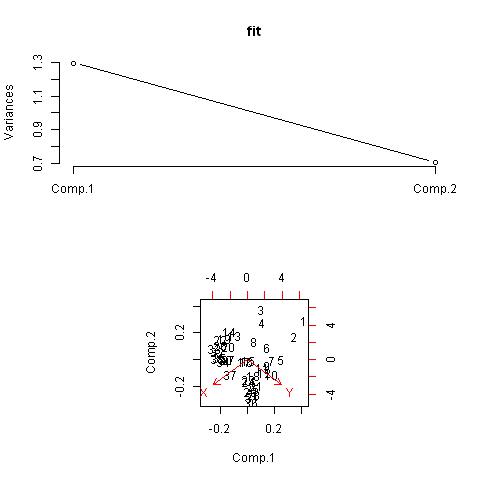
| plot(fit,type="lines") | #5: scree plot | |
| fit$scores | #6: the principal components | |
| biplot(fit) | #7: scree plot |