| n <- length(Y) | #1: set length of vector Y | |
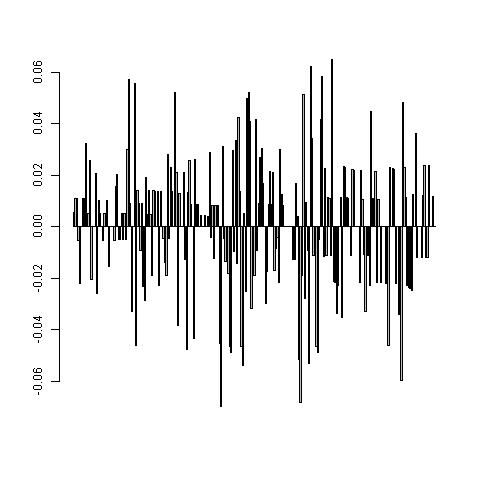
| ret <- log(Y[-1]/Y[-n]) | #2: calculate log return | |
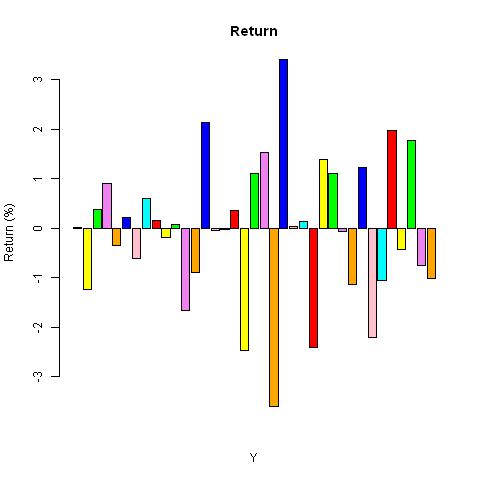
| colors = c("red", "yellow", "green", "violet", "orange", "blue", "pink", "cyan") | #3: define colors | |
| barplot(ret, col=colors, main="Return", xlab="Y", ylab="Return (%)") | #4: plot the return |